


Heatmap.com is a paid heatmap and session-recording tool for ecommerce stores, mostly on Shopify, that shows how much revenue each click, scroll depth and page element is linked to, not just how many clicks it got.
It is better than free heatmaps if you run a store with enough revenue to justify $199 a month or more and you want to rank what to test by dollars.
If you're doing under a few million a year or just starting with CRO, Microsoft Clarity is free and covers the basic click and scroll maps.
We have not used Heatmap.com ourselves. This review is based on the vendor's site, pricing page and help docs, plus real A/B tests from our database that started from heatmap and scroll-map findings.
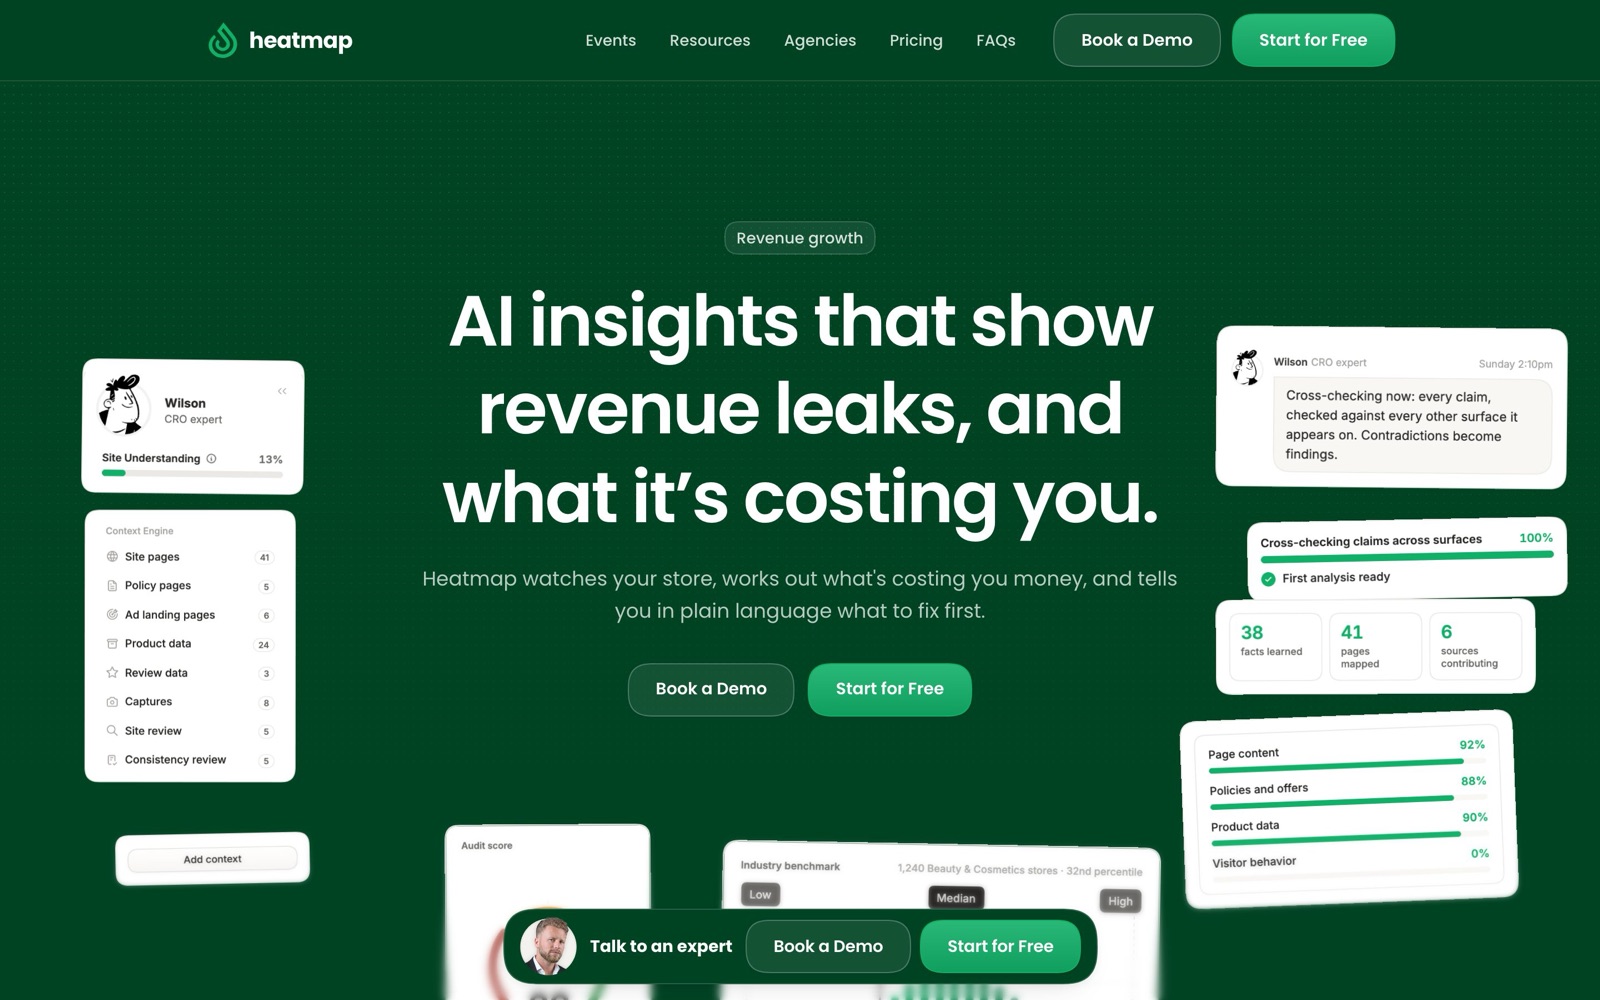
What Heatmap.com does: revenue per click, scroll and element
A normal heatmap shows where people click. Heatmap.com's homepage says it shows "what every button, image and block earned.
Not clicks: dollars." Its scroll maps show how far people get and what sits below the point where most of them stop.
Each visitor gets an anonymous ID that follows them through the session, so the tool can tie clicks, scrolls and views to any purchase made in that session.
The data definitions doc lists the main metrics:
- Element revenue: total revenue from all purchases linked to an element.
- Revenue per click: element revenue divided by element clicks.
- Revenue per session (RPS): total revenue divided by engaged sessions.
The vendor also lists revenue-tracked session recordings, custom funnels, journey analysis, on-site surveys, AI summaries that rank "revenue leaks" by priority, and an MCP server for querying your data from AI tools.
It says it captures "every session, no sampling."
One limit to keep in mind: element revenue is a correlation, not proof.
Buyers click on many things on their way to checkout, and the methodology doc doesn't explain how revenue is split when several elements sit on the same path.
Treat a high-earning element as a hypothesis, then confirm it with an A/B test.
That's how strong teams use heatmaps. Dave Diederen rewrote the above-the-fold USPs around the points heatmaps showed buyers engaging with and got +7.28% revenue per visitor in an A/B test.
Oliver Kenyon reordered a mobile menu by revenue per session and added a best-sellers slider, and the test reported +$48,607 per month.
Heatmap.com pricing
Heatmap.com prices by your store's annual revenue, not by sessions or pageviews.
As of November 2026, its pricing page lists three plans:
| Plan | Monthly price | Store revenue | Main differences |
|---|---|---|---|
| Launch | $199/mo | $0-10M | Limited "Talk to Your Data" AI; no MCP/API access |
| Growth | $349/mo | $10-25M | More AI access; custom onboarding |
| Scale | $699/mo | $25-50M | Full AI access, MCP/API, private Slack channel, dedicated success manager |
All three plans include unlimited heatmaps and scroll maps, custom funnels, revenue-tracked recordings, unlimited surveys and AI summaries, with full traffic coverage.
Each comes with a 14-day free trial, and paying annually saves "up to 32%," according to the pricing page.
Add-ons cost extra: a Revenue Intelligence Pack (about $399/mo), a Data & Integrations Pack (about $499/mo), a CRO Strategist service ($1,000/mo) and Concierge Onboarding ($750 one-time).
The page doesn't list a plan for stores above $50M, so larger brands should expect to talk to sales.
The downside is clear: there is no free plan, and the cheapest tier costs $2,388 a year at the monthly rate.
A store doing $500K a year pays the same as one doing $9M.
Shopify setup
Heatmap.com's homepage mentions a native Shopify app inside the Shopify admin. The Shopify installation guide describes two pieces:
- Tracking snippet: paste it into your theme's theme.liquid file before the closing head tag, placed first in the header.
- Conversion pixel: add it as a custom pixel under Settings, Customer Events, so purchases get linked to sessions.
After you verify the snippet, the guide says to wait about 12 hours for data to appear.
If you build pages with Replo, GemPages, Zipify or similar builders, you have to add the tracking snippet to those pages too, and headless Shopify stores have a separate guide.
It isn't Shopify-only. The installation help center has guides for WordPress/WooCommerce, BigCommerce, Magento, Google Tag Manager and custom sites.
Its pricing and marketing, though, are built around ecommerce revenue, so it's a poor fit for SaaS or lead-gen sites.
For more on running experiments on the platform, see our Shopify CRO guide and the list of Shopify A/B testing apps.
Heatmap.com finds the ideas, but you still need a testing tool to prove them.
Heatmap.com vs Microsoft Clarity vs Hotjar
These are the three tools most stores weigh against each other.
Here's how they compare based on each vendor's public pages as of November 2026.
| Heatmap.com | Microsoft Clarity | Hotjar (Contentsquare) | |
|---|---|---|---|
| Pricing model | By store revenue, from $199/mo | Free, no traffic limits | Free up to 200k sessions/mo; Growth from $39/mo billed yearly |
| Heatmaps and recordings | Yes, all traffic | Yes | Yes |
| Revenue tied to elements | Core feature on every plan | Not its focus | Revenue attribution on the custom-priced Pro plan |
| Shopify setup | Theme snippet plus custom pixel | Official Shopify app | Tracking code |
| Best for | Shopify brands with real revenue that want to rank tests by dollars | Any site that wants free click, scroll and replay data | Teams that want surveys, funnels and replays in one tool |
Microsoft Clarity is "free forever" with "no limits on traffic," according to its homepage.
It has heatmaps and session recordings and installs through an official Shopify app.
For most small stores, that's enough to spot dead clicks and content nobody scrolls to. Read our Clarity review.
Hotjar is now part of Contentsquare, and hotjar.com/pricing redirects to Contentsquare's pricing page.
The free plan covers up to 200k monthly sessions with replays, heatmaps, funnels and basic surveys.
Growth starts at $39 a month billed yearly.
Revenue attribution only shows up on the custom-priced Pro plan. See our Hotjar review.
Plain click and scroll data can still lead to big wins.
Peter Christensen moved the most compelling homepage sections higher based on scroll maps and saw +12.64% conversion rate.
Dave Diederen moved the most-clicked category to the first homepage tab for +14.40% revenue per visitor.
Neither result needed revenue-per-element data, but revenue data helps you rank which idea to test first.
Other options worth a look are Lucky Orange and Crazy Egg, two other heatmap and session-recording tools we review.
Our heatmap tools roundup covers the full field.
Who Heatmap.com fits
Good fit:
- Shopify or other ecommerce brands making roughly $1M-50M a year that run A/B tests regularly and need a way to rank ideas.
- Teams that keep arguing about which page sections matter, where a dollar figure next to each element ends the debate faster than click counts.
- Agencies running CRO for several stores, who can also look at Heatmap.com's partner program.
Not a good fit:
- New or small stores. $199 a month is a lot when Clarity's free heatmaps will show most of the obvious problems.
- SaaS, lead-gen and app businesses. The product and pricing are built around store revenue.
- Stores with little traffic, where per-element revenue numbers will be thin and noisy.
- Teams that won't follow up with tests. Revenue heatmaps point at problems, and the fix still has to be proven.
Heatmaps belong at the research stage of CRO: you observe behavior, form a hypothesis, then A/B test it.
Our customer research guide explains how heatmaps fit alongside surveys and user testing.
These tests from our database all began with heatmap or scroll-map findings:
 @oliverkenyon
 @DaveDiederen@DaveDiederen@DaveDiederen@DaveDiederen
 @peterac_
Two of them came from collection pages. Dave Diederen added a countdown timer where heatmaps showed shoppers were focused (+20.65% revenue per visitor) and turned a high-attention collection banner into a clickable countdown timer (+$161K revenue). Browse more in the full test database.
If you'd rather have someone turn heatmap data into a testing roadmap for your store:
Heatmap.com and Lucky Orange have affiliate programs, so we may earn a commission if you sign up through the links below. It doesn't change our assessment.